

Undercapitalized Trader: Scale Capital, Not Risk
The problem is not your returns. It is your capital. Learn why scaling risk destroys accounts and how funded accounts solve undercapitalization.

An undercapitalized trader is someone trying to extract income that their account size cannot support at a safe return rate. The fix is not trading better or risking more per trade. The fix is getting more capital under management and keeping risk per trade exactly the same.
Most traders who struggle with income targets have the same blind spot. They assume the problem is their strategy, their win rate, or their discipline. But the math tells a different story: a $100,000 account at 5% monthly return produces $5,000. If you need $10,000, you do not need a better strategy. You need $200,000.
TL;DR
Undercapitalization means your income goal demands an unsustainable monthly return from your current account size.
Increasing risk per trade to compensate is the fastest path to blowing an account.
A $100,000 funded account at 5% monthly return produces $60,000 per year, which already puts you in the top 3% of retail traders.
Scale capital by reinvesting funded account payouts into new evaluation challenges.
The path from $100,000 to $400,000 in funded capital is a 12 to 18 month process, not a weekend project.
The Real Problem Isn't Your Win Rate
You have a 30% win rate with a 5:1 reward-to-risk ratio. You have been profitable three months in a row. You averaged 5% monthly on a $100,000 account. That is $5,000 per month.
And it does not feel like enough.
So you start looking for the problem. Maybe your entries are too conservative. Maybe you need a second strategy. Maybe your win rate needs to jump to 50%. Sound familiar?
The problem is not with the returns. It is your capital.
$5,000 per month from a $100,000 account is a 5% return. Most funded traders would consider that excellent, and it puts you well inside the top tier of retail performance. But if your living expenses require $10,000, you are staring at a gap that no strategy tweak will close.
Here is the math that changes your perspective. Making $10,000 per month from $100,000 requires a 10% monthly return. That is 120% annualized. Hedge funds with billion-dollar research teams average 15 to 20% per year. You are not going to sustain 120% from a home office.
The traders who earn $10,000 per month are not generating 10% returns. They are generating 5% returns on $200,000. Or 5% on four separate $50,000 accounts. The return stays the same. The capital does the work.
Walkthrough: The Income Gap Exposed
You trade EUR/USD on a $100,000 funded account. Your risk is 1% per trade ($1,000). Your average winner is 3R ($3,000). Over 20 trades in a month, you win 7 and lose 13.
Math check: 7 wins at $3,000 each = $21,000. 13 losses at $1,000 each = $13,000. Net profit = $21,000 minus $13,000 = $8,000. Win rate = 7 / 20 = 35%. Monthly return = $8,000 / $100,000 = 8%.
That is a strong month. But you need $10,000. You are $2,000 short. The temptation is to bump risk to 1.25% next month. That is where accounts start dying.
Why Increasing Risk Fails Every Time
The logic sounds clean: if 1% risk produces $8,000, then 1.5% risk should produce $12,000. Just move the dial up.
The problem is that risk does not scale linearly in your head. It scales emotionally.
At 1% risk on a $100,000 account, a single loss costs $1,000. Three consecutive losses cost $3,000. Uncomfortable but survivable. Your process stays intact.
At 2% risk, a single loss costs $2,000. Three consecutive losses cost $6,000. That is 6% of your account in three trades. Now your throat tightens. You start hesitating on the next valid setup. You move your stop closer to reduce the pain. You skip a trade because the last three hurt. You take a low-quality trade because you need to "make it back."
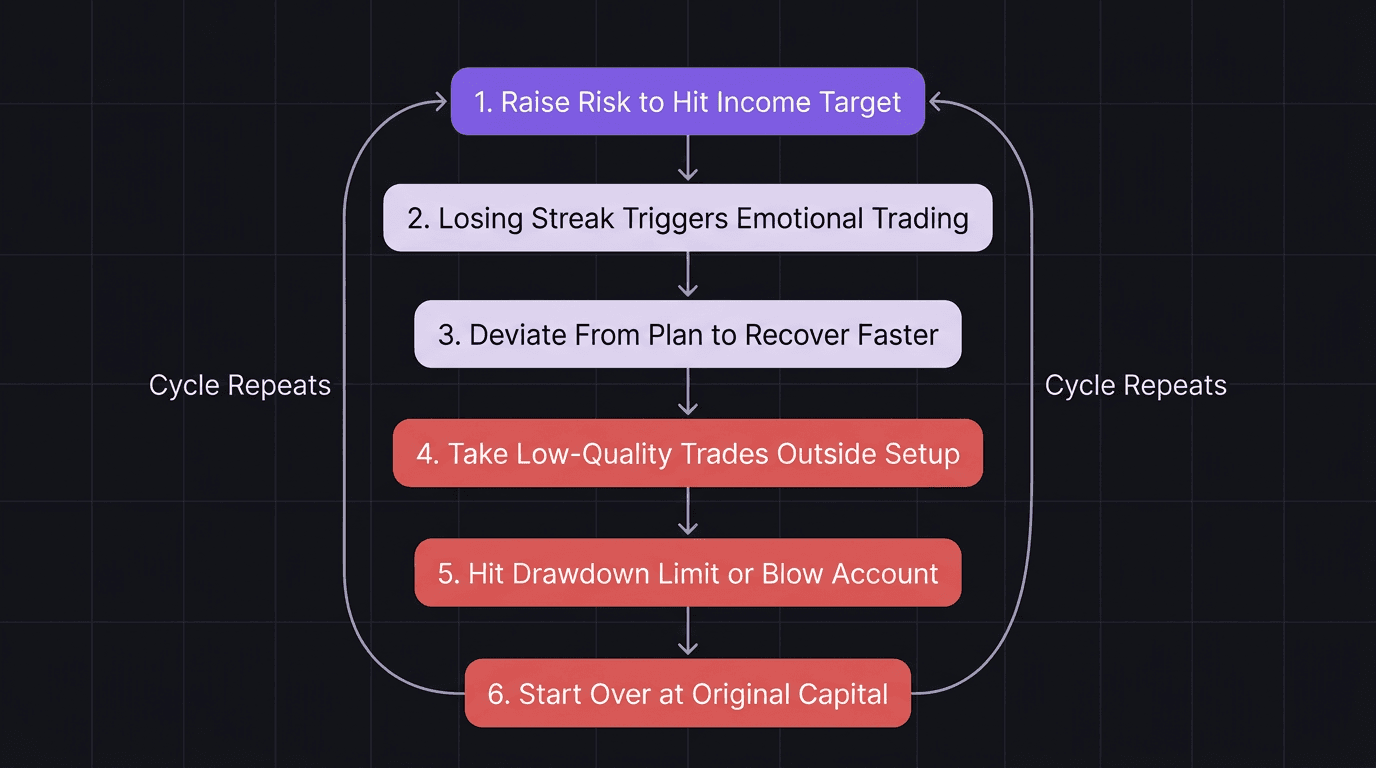
This is the drawdown spiral. It starts the moment your position sizing exceeds what your psychology can handle.
Every trader who has tried to scale up by increasing lot size has felt this sequence:
Raise risk to hit income target.
First losing streak triggers emotional trading.
Deviate from the plan to recover faster.
Take low-quality trades outside your setup.
Hit drawdown limits or blow the account.
Start over at the original capital level (or lower).
The cycle repeats because the root cause never gets addressed. The capital is too small for the income goal. Not the strategy.
Walkthrough: What Doubling Risk Actually Does
Same trader, same EUR/USD strategy, same 35% win rate and 3R average winner. But now risk is 2% per trade ($2,000) because they want to hit $10,000.
Month starts with 4 consecutive losses.
Math check: 4 losses at $2,000 each = $8,000 drawdown. Account balance = $100,000 minus $8,000 = $92,000. Drawdown percentage = $8,000 / $100,000 = 8%.
Most funded accounts have a 10% maximum drawdown rule. You are at 8% after four trades. You have used 80% of your drawdown allowance with 16 trades still to go.
At 1% risk, the same 4 losses would cost $4,000 (4% drawdown). Plenty of room to recover. At 2% risk, you are one bad trade from losing the account.
The Capital Ladder: $100k to $400k
The solution is not complicated. You grow capital, not risk. Think of it as a ladder with clear rungs.
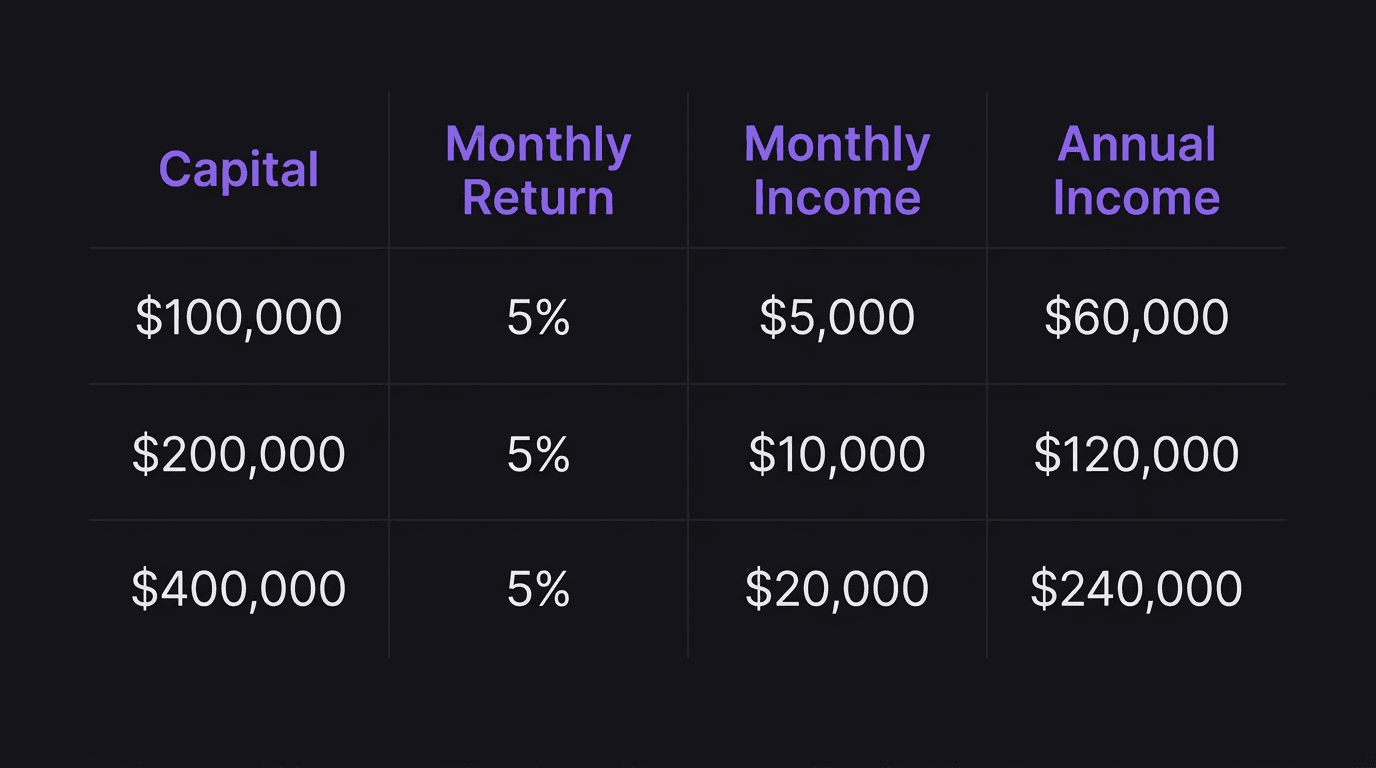
Rung 1: $100,000 at 5% = $5,000 per month
One funded account. Conservative risk. You prove consistency for 2 to 3 months before doing anything else. $5,000 per month is $60,000 per year. That is already significant additional income, and it puts you in the top 3% of retail traders. Do not dismiss this number.
Rung 2: $200,000 at 5% = $10,000 per month
Two funded accounts. Same strategy, same risk percentage, same process. The only thing that changed is total capital under management. Your monthly return target stayed at 5%.
Rung 3: $400,000 at 5% = $20,000 per month
Four funded accounts. Same 5% target. $240,000 per year. You arrived here without ever risking more than 1% per trade on any single account.
The key insight: at every rung, the strategy is identical. The returns are identical. The risk per trade is identical. Only the capital changed.
This is the prop firm scaling plan that actually works. You are not trying to extract more from the same account. You are multiplying the number of accounts while keeping each one boring and conservative.
Reinvest Payouts Into New Challenges
Here is the mechanical process for climbing the capital ladder.
Step 1: Prove consistency on one account. Trade your $100,000 funded account for 2 to 3 months. Hit your payout. Do not rush this. If you cannot be consistent on one account, adding a second one will just double your problems.
Step 2: Use payouts to fund the next challenge. Most funded account evaluations cost between $300 and $600. If you are making $5,000 per month from your first account, you can easily afford a second evaluation without touching your personal savings.
Step 3: Run both accounts with identical risk. Same strategy. Same 1% risk. Same session. Same rules. The second account is not an experiment. It is a copy of what already works.
Step 4: Repeat when the second account is stable. After 2 to 3 consistent months on both accounts, use payouts to fund a third challenge. Then a fourth.
The timeline is realistic. If your first account is already funded and consistent, you can reach $200,000 in capital within 3 to 4 months. Reaching $400,000 takes 12 to 18 months. That sounds slow until you compare it to the alternative: blowing three accounts in a row because you cranked risk to 3%.
The discipline required is simple but hard: do not add a new account until the existing ones are stable. Two to three months of consistent payouts per account before moving on. If an account goes into drawdown, fix that account before adding another.
What "Consistent" Actually Means
Consistency here is not about hitting exactly 5% every month. It means:
No drawdown breaches.
No emotional trading episodes that broke your rules.
Positive net return across the period.
No increase in risk per trade to chase a target.
If you had one bad month out of three but stayed within your risk rules and recovered, that counts. If you hit 8% one month but deviated from your plan to get there, that does not count.
How EdgeFlo Shows You the Capital Gap
This is where most traders get stuck: they feel undercapitalized but never quantify the gap. They trade harder instead of trading smarter.
EdgeFlo's trading dashboard tracks account equity across sessions, giving you a clear picture of your actual monthly return percentage. When you can see that your $100,000 account produced exactly 4.7% last month, you can do the math: $4,700 this month means you need roughly $210,000 in total capital to hit $10,000 at the same return rate.
That visibility changes the conversation. Instead of asking "how do I make more from this account," you start asking "how do I get more capital at this return rate?" The dashboard makes the gap obvious, and obvious gaps get solved.
EdgeFlo also tracks performance across sessions and pairs, so when you do add a second funded account, you can compare execution quality between them. If your second account is underperforming, the data shows you why before it becomes a drawdown problem.
How much capital do you need to make $10,000 per month trading?
Is $100,000 enough to trade full time?
How do undercapitalized traders blow their accounts?
What is the best way to grow trading capital without extra risk?

Turn discipline on.
Every session.
EdgeFlo is the environment serious traders operate inside.
Start 7-Day Trial — $7
Cancel anytime.
No long-term commitment.


Think Different, Trade Different.